

By: Andy Leidof
Environmental investigation and remediation are hard to spot in our everyday lives. There are sampling wells, remediation injections, and contamination plumes all happening underground, making environmental challenges mysterious. This is where CAD design comes in to help visualize the environmental data in a way that makes sense.
CAD design interprets the data and sample points our scientists work on into drawings to show the underground (or subsurface) view, just like a map you would use for your building. However, instead of showing the grass and concrete, CAD drawings provide locations of sampling wells, injection points and contamination plumes along with an underground point of view. Environmental engineers and scientists use them to evaluate site conditions and to develop plans for investigation and remediation.
The challenge for clients who don’t specialize in environmental science is that the drawings and data can be challenging to read and follow. This is where data visualization using CAD can help clients and regulators understand the nature and extent of the environmental challenges of a site. This understanding of the underlying conditions can allow for expedited approvals for the client and instill trust in their environmental consultant.
What is CAD?
CAD stands for computer-aided design (also known as CADD). CAD is a computer software technology used for detailed design and now replaces manual drafting with a digital drafting process. Designers, architects, or, in our case, engineers use 2D or 3D CAD programs to create their site drawings, project plans and equipment layouts. Site geology can be clearly communicated with CAD using cross sections that outline soil and rock lithologies.
The visualization of data through CAD drawings allows evaluations using different approaches in order to determine the best method to move forward on environmental work. The data collected from survey data and site visits are converted into a visual map that helps engineers and scientists navigate the site so they can strategize about the best way to approach the environmental investigation and remediation plans. The elements of modeling, analysis, and visualization using CAD drawings bring environmental projects to life for the technical teams and the clients alike.
Four different types of CAD drawings
There are a variety of CAD drawing options available to CAD operators to help clients and regulators visualize the data. Here are a few common types of CAD drawings in the environmental field.
Plan View
The plan view shows the general features and elements of a property through an aerial point of view. The site plan allows a greater understanding of how site features are spatially laid out. Features can include cities, neighborhoods, property addresses or individual buildings and roads, structure walls and bodies of water like lakes or ponds. These can all be viewed from a site plan drawing. This drawing allows high-level visualization of an area without obstructions from vegetation and traffic.

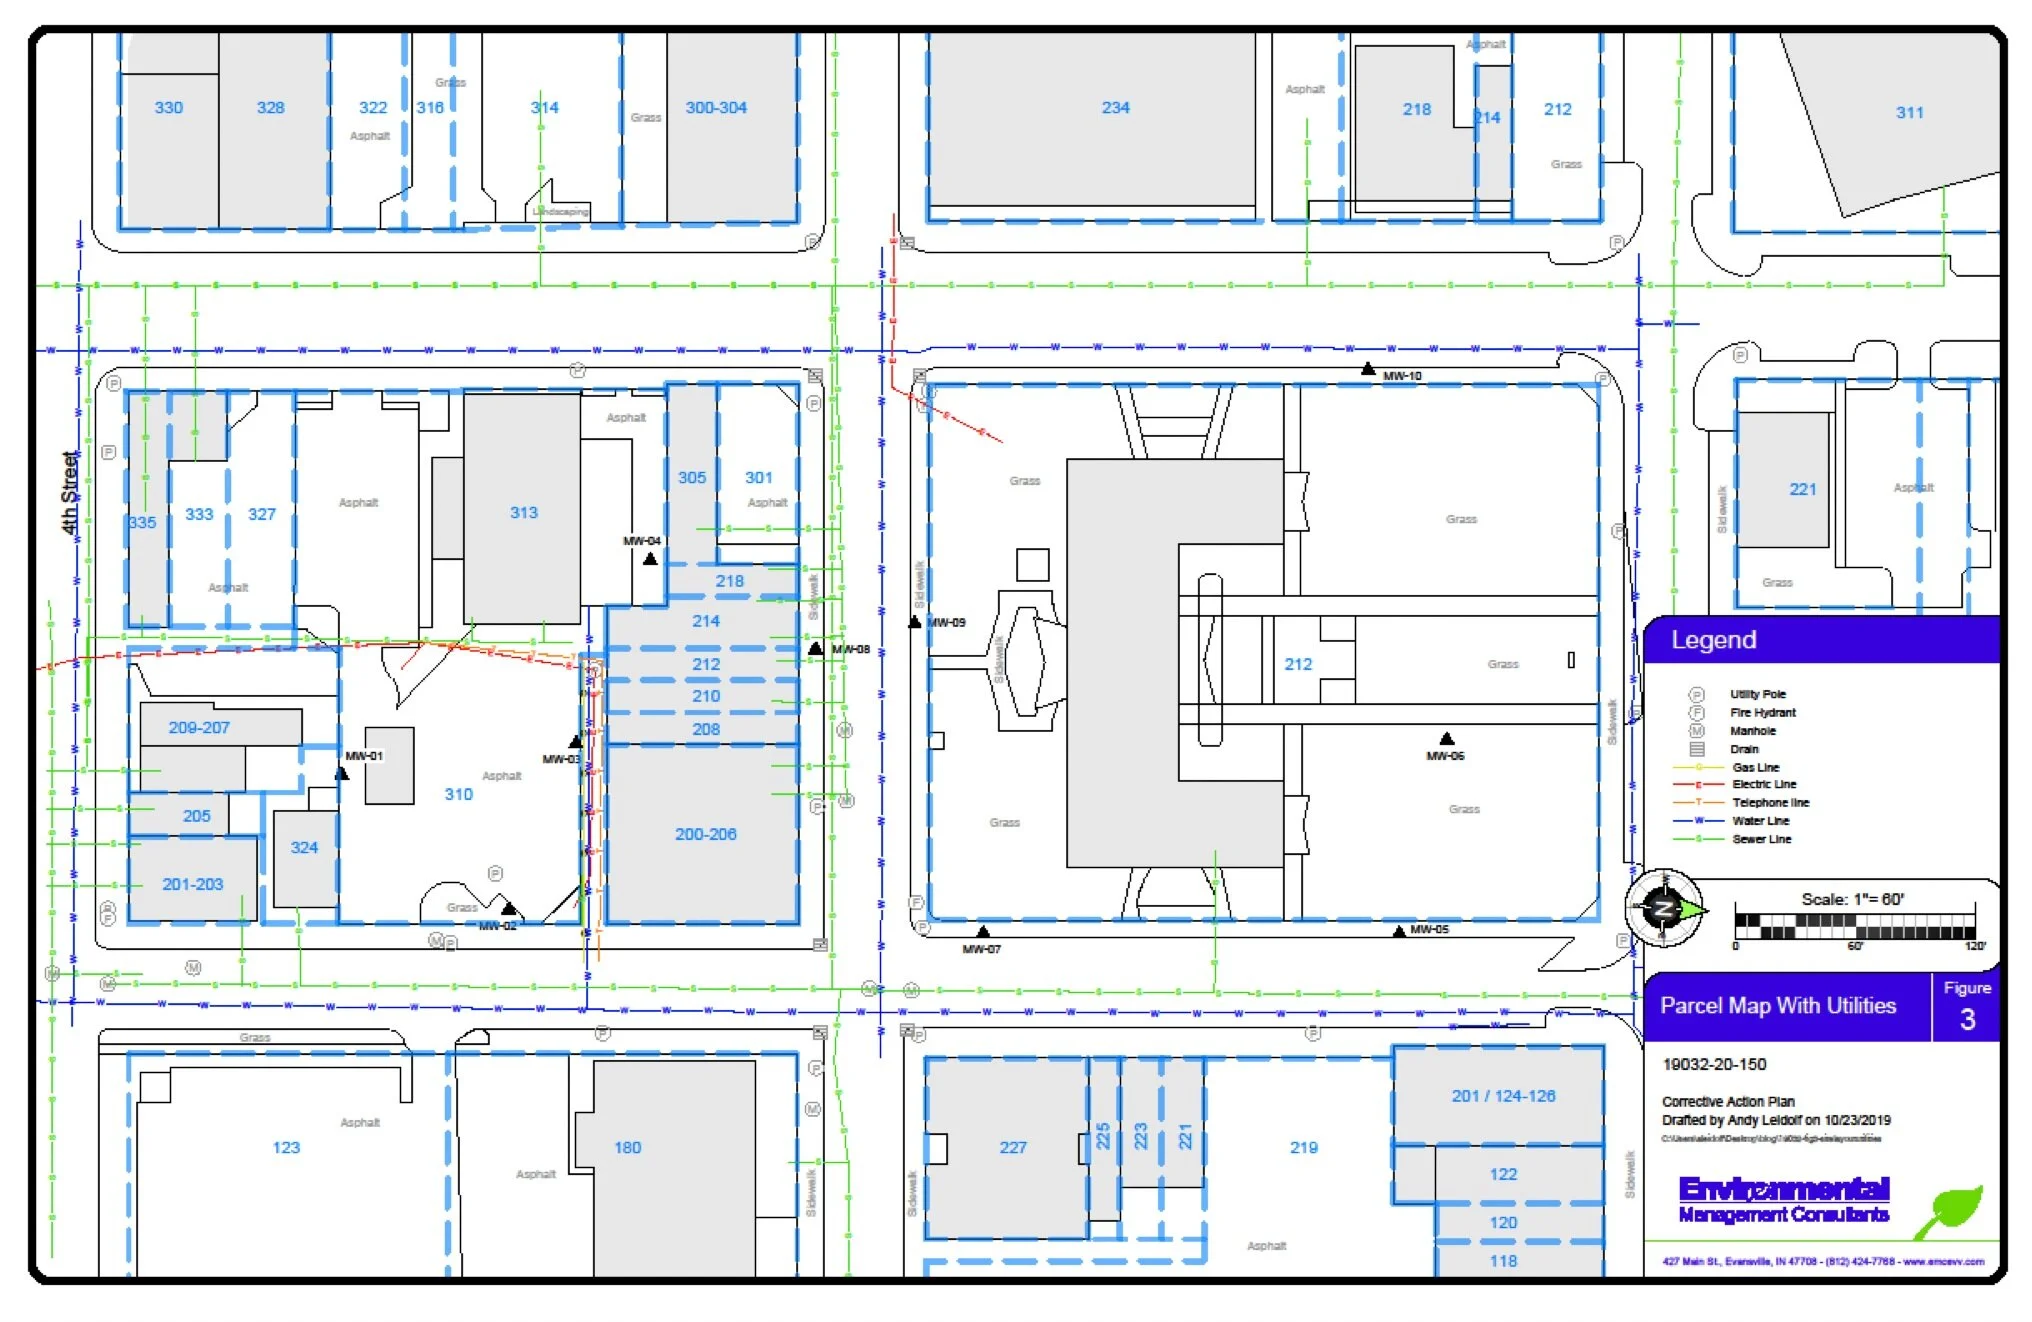
Site Map
The site map indicates the locations of features related to the environmental investigation and remediation of a property. This map can include utility lines, soil and groundwater sample points, monitoring well locations, injections points, both actual and proposed. This drawing helps the skilled professional visualize and plan for potential safety risks and other important details on a particular site.
Cross Sections
The cross-section drawing is a slice through an impacted area or other area of a site for the purpose of visualization the underground conditions of the site. A cross section may include the site geology, monitoring well layout and screen placement, analytical sample results, static water levels and outlines of impacted soil and groundwater. This drawing helps scientists and engineers visualize the site in a way that helps evaluate stages of remediation and measure cleanup success.

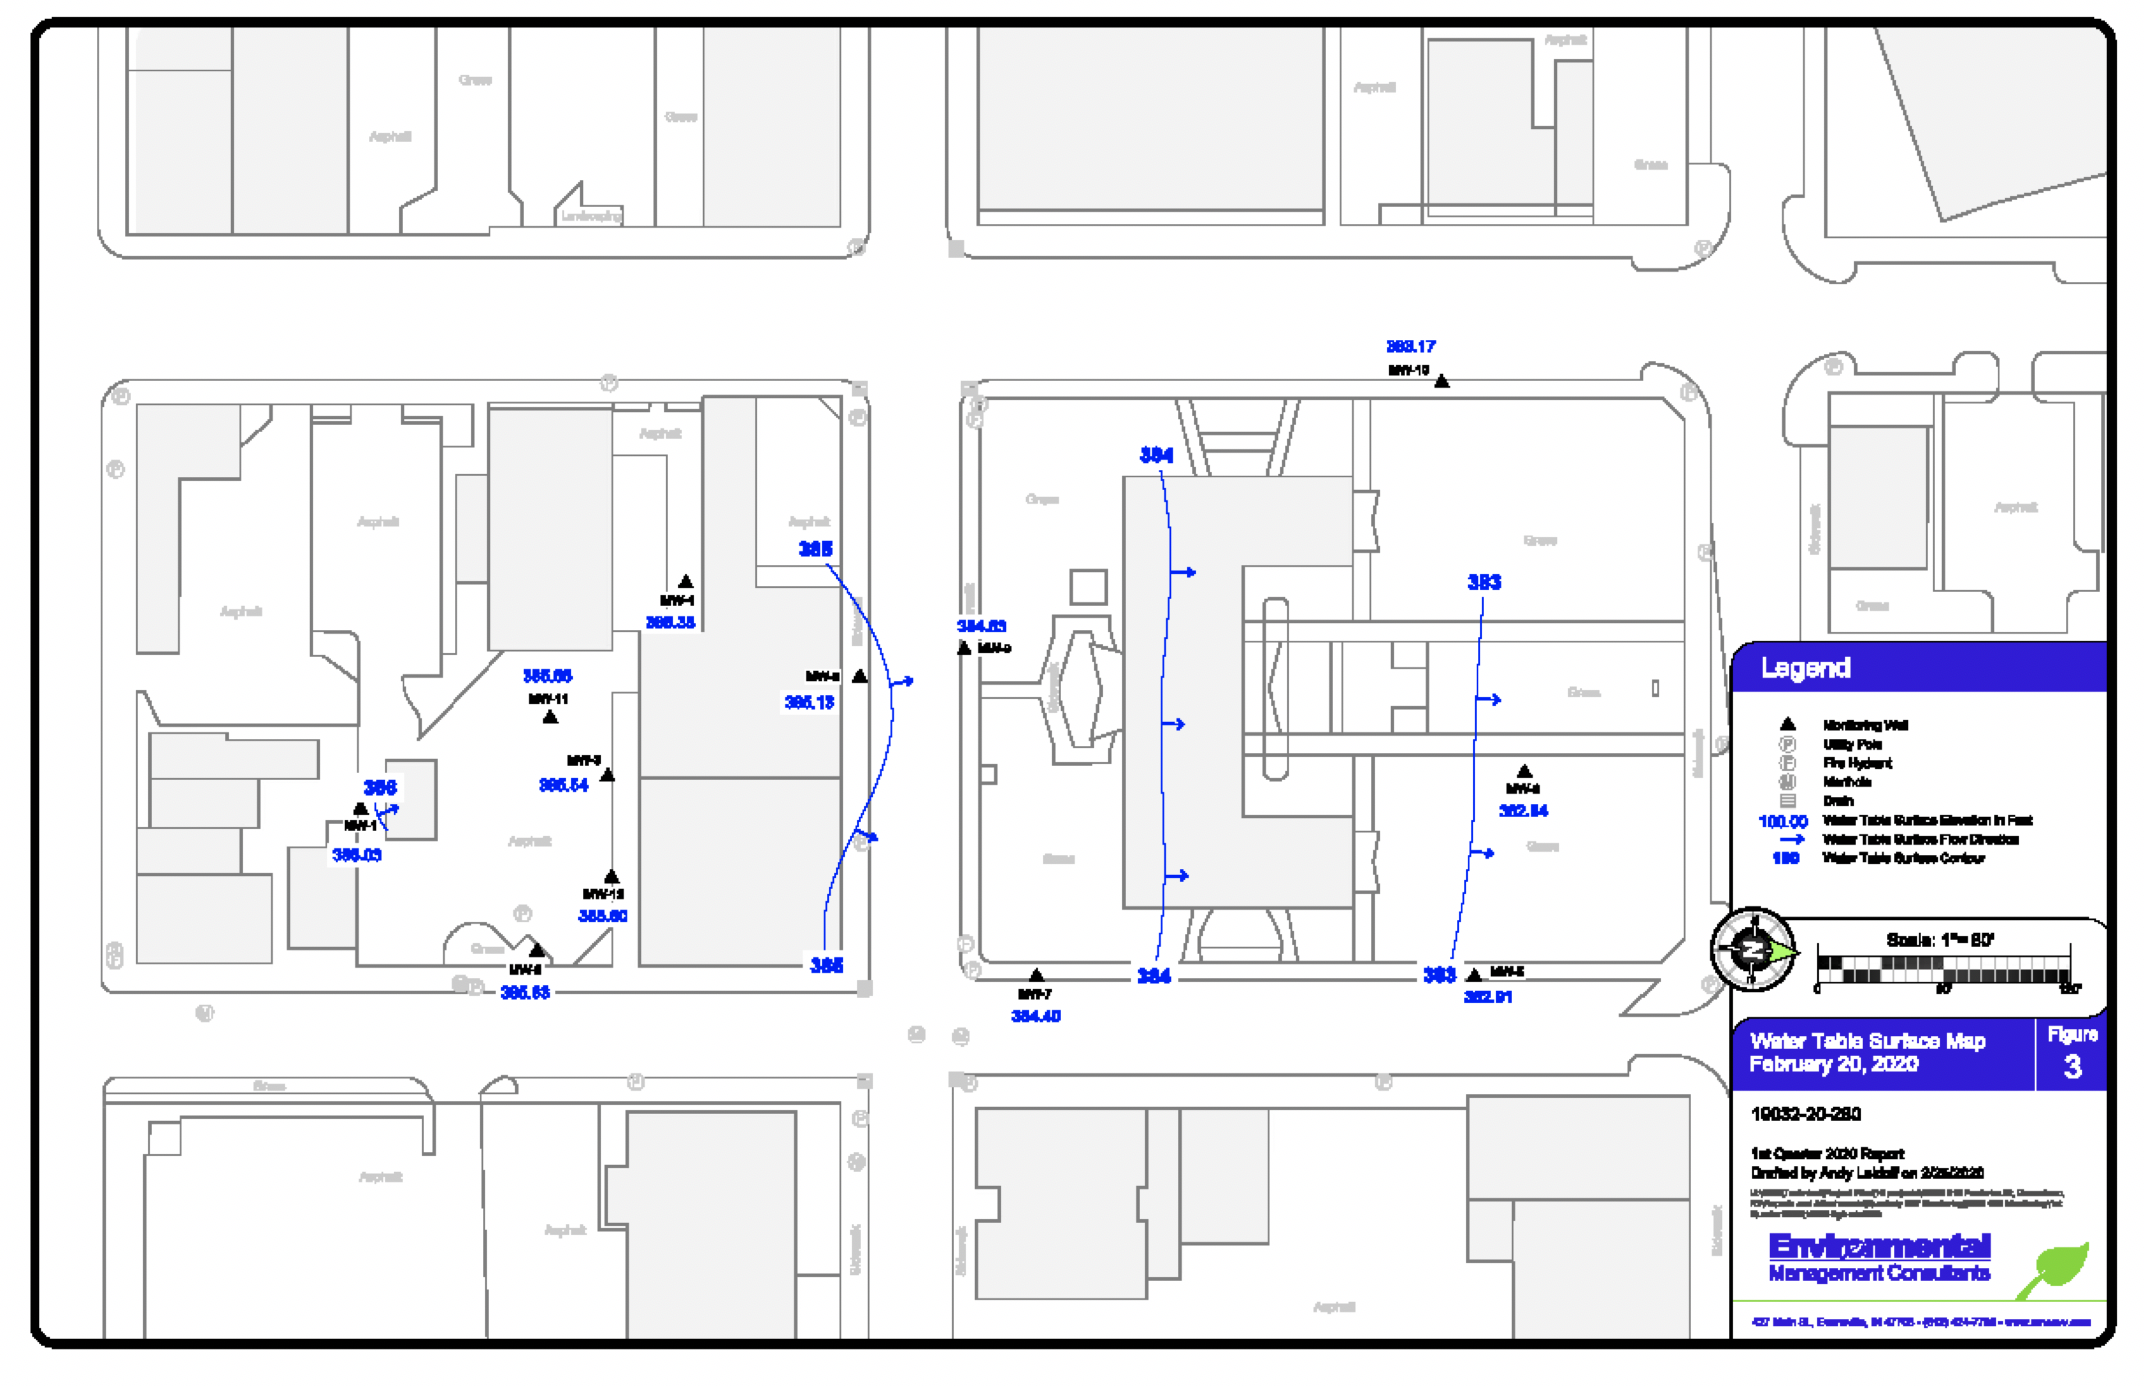
Analytical
The analytical map can include data tables, areas of concern, and isoconcentration contours. Maps show an aerial point of view of data as it is related to static water levels, chemical concentrations or site topography. This includes types and concentrations of contamination and where they can be found on the site. This drawing helps visualize the highest concentrations of contamination and helps scientists and engineers design plans to remediate environmental contamination and ultimately monitor environmental contamination levels.
How to read CAD drawings
Here are some helpful pointers from EMC’s CAD Operator:
Each project includes a set of drawings that show something different about your property. For example, there may be drawings to show aerial views of sampling locations and site features. Cross section drawings would show site geology which might contain lithology types such as clay or gravel.
Each drawing has a legend to guide the reader through the different elements drawn and a scale to show the ratio between distances. The legend is an important part of any drawing and helps the user identify site features.
If you have questions about what you see on your property’s drawings, reach out to your environmental consultant for a further explanation. We are here to make the environmental investigation and remediation process as straightforward as possible.
If you have questions about starting an environmental investigation or remediation project, contact EMC today.